Chapter 2 Merging files
2.1 Introduction
We want to merge the Full-Year Consolidated Data file with the Medical Conditions file so that we can identify patients with a diagnosis of diabetes.
2.2 Load MEPS data
We need to lead the MEPS Full-Year Consolidated Data file and the Medical Conditions file from 2020. There are two methods to loading MEPS data into R. Method 1 requires you to know the name of the file. For example, the Medical Conditions file from 2020 is named h222. In Method 2, you need to know the type = of data you want to load. For example, the Medical Conditions file is named CONDITIONS.
I like to work with column names that are in the lower case, so I used the tolower function to change the column names from upper case to lower case.
### Load the MEPS package
library("MEPS") ## You need to load the library every time you restart R

#### Method 1: Load data from AHRQ MEPS website
hc2020 = read_MEPS(file = "h224")
mc2020 = read_MEPS(file = "h222")

#### Method 2: Load data from AHRQ MEPS website
hc2020 = read_MEPS(year = 2020, type = "FYC")
mc2020 = read_MEPS(year = 2020, type = "CONDITIONS")

## Change column names to lowercase
names(hc2020) <- tolower(names(hc2020))
names(mc2020) <- tolower(names(mc2020))
2.3 Merge MEPS data
Now that we have both the h224 and h222 file loaded into R, we can marge these files together. The Full-Year Consolidated Data file contains unique patients (e.g., each row is a unique patient); hence, the unique identifier dupersid is not repeatable. Figure 1 illustrates an example of a table with each row as a unique subject. Note how the dupersid does not repeat.
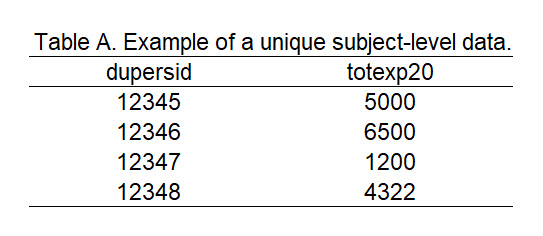
Figure 2.1: Figure 1 - Example table with unique patients.
However, in the Medical Conditions file, the rows are for the number of unique diagnosis grouped by the patient. In other words, the Medical Conditions file will contain repeated dupersid for each diagnosis. For example, a person can have 5 diagnosis grouped by their dupersid. In Figure 2, we have an example table with a subject dupersid = 12345 who has five diagnosis (icd10cdx).

Figure 2.2: Figure 2 - Example table where the unique patient identifier repeats.
When we merge the Full-Year Consolidated Data file (which is unique to the dupersid) with the Medical Conditions file (which has repeatable dupersid), we will merge using a 1 to many merge (Figure 3a). Figure 3a illustrates the merge between the unique subject-level table to the repeatable subject-level table.
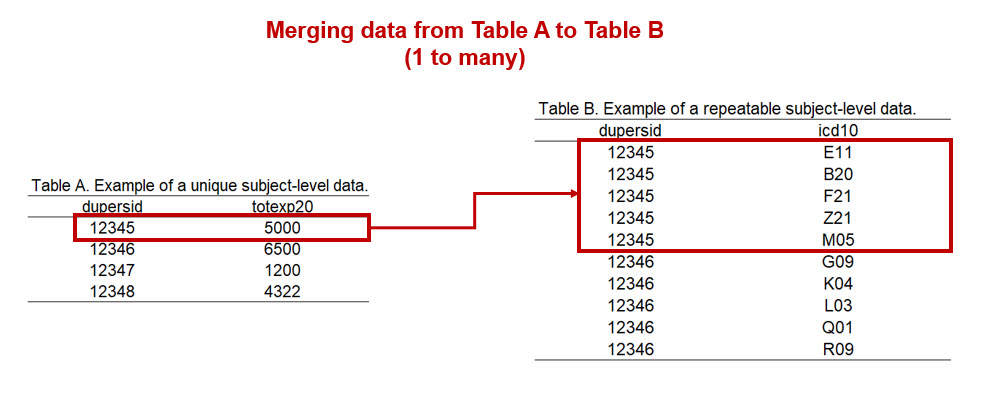
Figure 2.3: Figure 3a - Merging tables (1 to many).
But we also want to make sure that we include all the patients in the Full-Year Consolidated Data file. Not all patients will have a diagnostic code, so we need to be careful that we don’t accidentally drop them from the query. Figure 3b illustrates our intention to merge all the data from the Full-Year Consolidated Data file with some of the data from the Medical Conditions file.
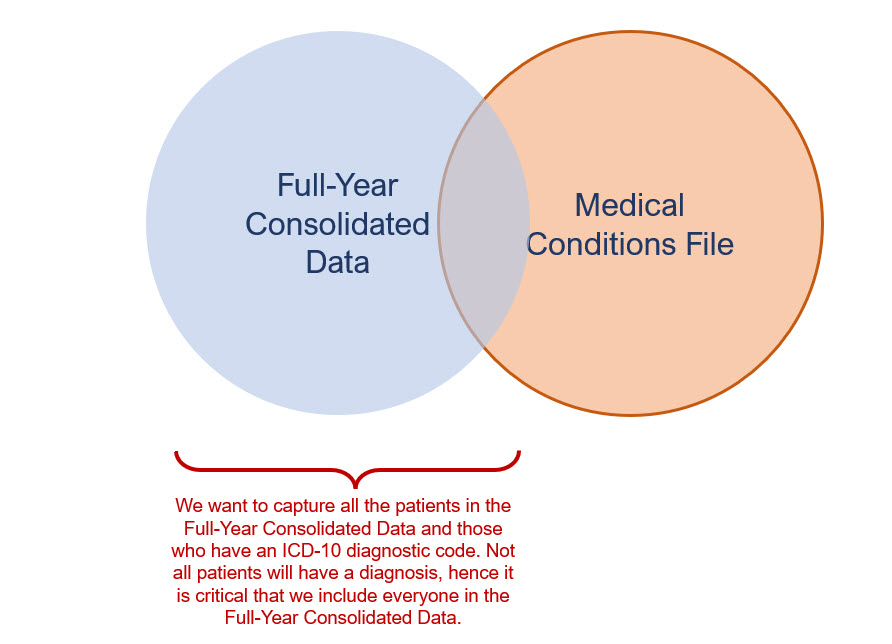
Figure 2.4: Figure 3b - Merging tables with all patients in the Full-Year Consolidated Data file and some of the data from the Medical Conditions file.
Now that we understand how we want to merge the data, we can proceed to write the code.
There are two methods to merge the data files.
Method 1: We use the merge function to merge the two MEPS data files. The by = option is where we enter the matching variable dupersid. We will call the merged data set total. Using the `merge function, we are telling R that we want to do a 1 to many match between the Full-Year Consolidated Data file and the Medical Conditions file using the dupersid as the matching variable. We have to include the all.x = TRUE argument because we want to make sure we include the patients without any diagnostic codes.
## MERGE data - Medical conditions and household component
# merge two data frames by ID; there are two methods to do this:

#### Method 1: Native R function; Note: all.x means that we pull all dupersid, even the ones that don't have a medical condition)
total <- merge(hc2020, mc2020, by = "dupersid", all.x = TRUE)
Method 2: We use the left_join function from the dplyr package to merge the two MEPS data files. The by = option is where we enter the matching variable dupersid. We will call the merged data set total. Using the left_join function, we are telling R that we want to do a 1 to many match between the Full-Year Consolidated Data file and the Medical Conditions file using the dupersid as the matching variable. The left_join function is based on the SQL language syntax and operates in the same manner.
#### Method 2: Use SQL syntax (left_join)
library("dplyr")
total <- left_join(hc2020, mc2020, by = "dupersid")
Once the two data files are merged, we will have a data frame with repeatable dupersid. Notice that the totexp20 variable from Table A is merged along with the icd10 variable from Table B.
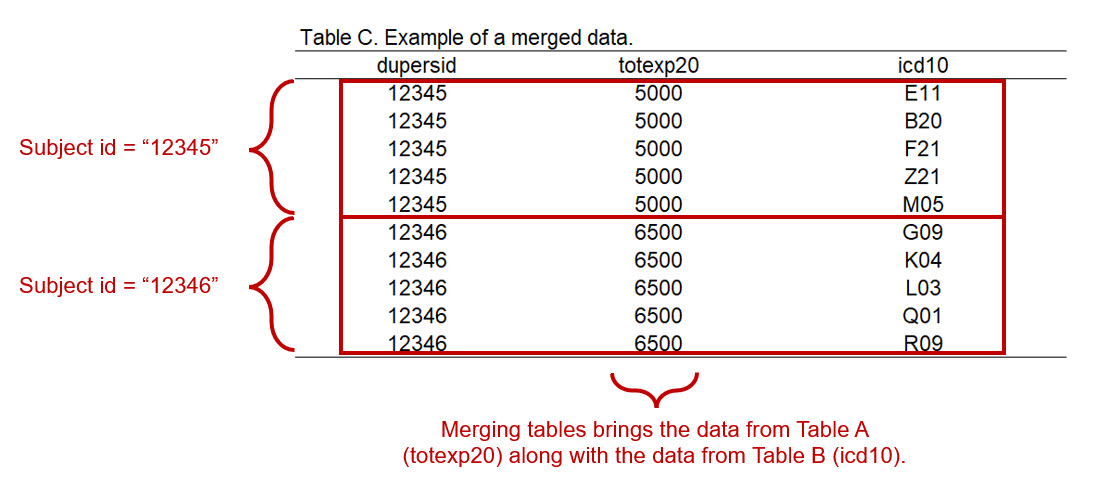
Figure 2.5: Figure 4 - Merging data from Table A to Table B.
2.4 Reduce dataframe to a few variables
Our total dataframe has 1481 variables and 80,802 observations. We want to make this dataframe manageable, so we’ll create a limited dataframe with only the variables we’re interested in. To do this, we’ll use the subset() function.
For this exercise, we’ll keep the dupersid, varpsu.x, varsry.x, perwt20f.x, and icd10cdx variables by using the subset() function. We’ll call our reduced dataframe keep_mep2. (Note: The *.x indicates the table on the left. We want to keep the varpsu, varstr, and perwt20f from the hc2020 table. The mc2020 table has duplicate variables that are denoted by *.y.)
keep_meps2 <- subset(total, select = c("dupersid", "varpsu.x", "varstr.x", "perwt20f.x", "icd10cdx"))2.5 Add an indicator for a specific ICD10 diagnostic code
Our data frame has multiple rows grouped by the patient’s id (dupersid); these rows are based on the various ICD-10 diagnostic codes. For example, patient 12345 has 5 ICD-10 diagnostic codes; hence, they have 5 rows (Figure 4).
Suppose we want to generate a binary indicator to identify patients with an ICD-10 diagnosis for diabetes (E11). In our example (Figure 4), patient 12345 has an ICD10 code for diabetes (E11).
We can create an indicator variable that will be unique to the patient for having diabetes. What we want to see if a new variable that identifies a patients with the specific ICD-10 code of interest. Figure 5 illustrates the indicator variable for diabetes as an additional column diabetes_indicator.
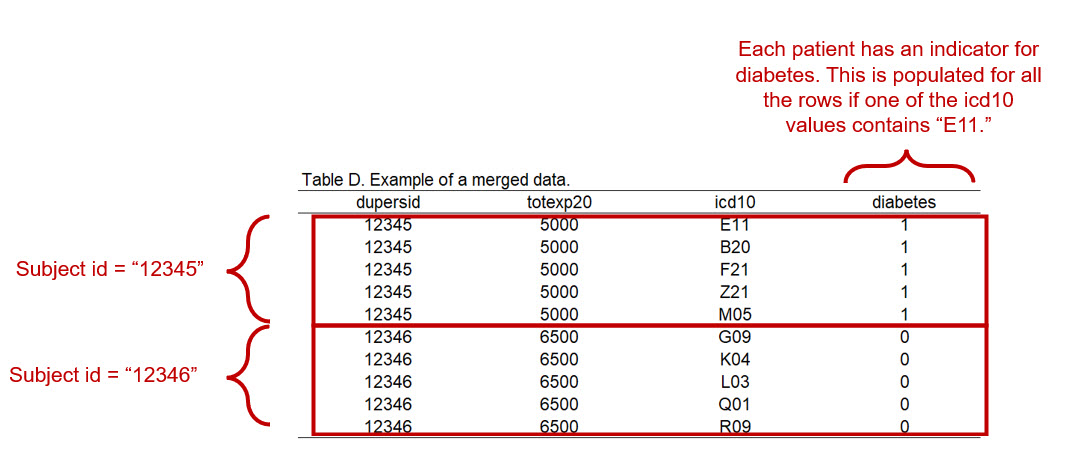
Figure 2.6: Figure 5 - Indicator variable for diabetes.
We create the indicator and call it diabetes, which is defined as icd10cdx == "E11". We will code this as 0 for no diabetes and 1 for diabetes. Then, we count the number of time a patient as E11 in their icd10cdx column. I added the following option to the code (| is.na(total$icd10cdx)) because I want to make sure that all patients in the total table that do not have an ICD-10 code for E11 is coded as 0. There may be some patients that have NA or missing data in the icd10cdx variable. If the icd10cdx value is NA, this may not be coded with a 0. Hence, we have to add the | is.na(total$icd10cdx code to ensure that we get a value of 0.
## Change to unique subject (each row is a unique subject)
#### Generate a variable to identify diabetes diagnosis for repeated rows
library("tidyverse")  ## Load tidyverse

keep_meps2$diabetes[total$icd10cdx != "E11" | is.na(total$icd10cdx)] = 0
keep_meps2$diabetes[total$icd10cdx == "E11"] = 1

table(keep_meps2$diabetes) ## Visualize the number of patients with diabetes and no diabetes
##
## 0 1
## 87345 2693### This code chunk calculates the number of times E11 appears for a unique patient
keep_meps2 <- keep_meps2 %>%
group_by(dupersid) %>%
mutate(diabetes_indicator = sum(diabetes == "1", na.rm = TRUE)) %>%
ungroup
table(keep_meps2$diabetes_indicator)##
## 0 1 2
## 71804 17295 939According to our results, there were 17,295 events where a patient had one diagnostic code for E11 and 939 events where a patient had two diagnostic codes for E11. How did this occur? MEPS public files only list the first three digits of the ICD-10 code to protect the identity of the patient. The ICD-10 diagnostic code has more digits beyond the first three. For example, an ICD-10 diagnosis for Type 2 diabetes with diabetic chronic kidney disease is E11.22. Hence, there will be patients with unique ICD-10 codes that may appear identical because only the first three digits are present in the MEPS public files.
In our example, we have patients with 1 and 2 ICD-10 diagnostic codes for E11. We would like to create a binary indicator of diabetes, so we need to take the current information and transform the variable diabetes in the keep_meps dataframe into a new variable that only has 0 and 1.
We can do this by combining the mutate function with the ifelse function. See the code below:
keep_meps2 <- keep_meps2 %>%
  group_by(dupersid) %>%
  mutate(diabetes_binary = ifelse(diabetes_indicator >= 1, 1, 0), na.rm = TRUE) %>%
  ungroup
table(keep_meps2$diabetes_binary)
##
## 0 1
## 71804 18234Now, we have a new binary indicator variable. The diabetes_binary variable is coded 1 if the patient has the E11 diagnostic code and 0 if the patient does not.
2.6 Collapse dataframe to a single unique patient
But since this is a dataframe with duplicated patients, we want to collapse this into a dataframe where each row is a single unique patient.
Since a lot of the variables in the dataframe are the same when grouped by the unique dupersid, we can estimate the mean and get the same value. For example, let’s look at Figure 5 again. For dupersid == 12345, there are five values for totexp20, which are:
5000whenicd10isE11,5000whenicd10isB20,5000whenicd10isF21,5000whenicd10isZ21, and5000whenicd10isM05
Averaging the totexp20 for dupersid == 12345 will result in a value of 5000.
Hence, when we average the diabetes diabetes_binary variable, we will get a value of 1 or 0.
Using this knowledge, we can collapse our data to a single dupersid and remove the duplicates.
The icd10cdx variable will yielded NA because it can’t be collapsed numerically due to its string data type.
\(~\)
There are two methods to collapse the dataframe to unique patients:
Method 1: Use the dplyr package and the summarize_all function with the list() function.
#### Collapse the repeated rows to a single unique subject
meps_per <- keep_meps2 %>%
  group_by(dupersid) %>%
  summarize_all(list(mean))

table(meps_per$diabetes_binary)
##
## 0 1
## 25202 2603\(~\)
Method 2: Use the summarise function. This method will generate a dataframe with two variables (dupersid and diabetes_binary2).
meps_per2 <- keep_meps2 %>%  ### An alternative method but only generates two variables (dupersid and diabetes_binary2)
  group_by(dupersid) %>%
  summarise(diabetes_binary2 = mean(diabetes_binary)) %>%
  as.data.frame()

table(meps_per2$diabetes_binary2)
##
## 0 1
## 25202 2603For the rest of the tutorial, I’ll use Method 1 because I want to keep the other variables.
Figure 6 illustrates what our dataframe should look like after we collapsed the data to a single unique patient.

Figure 2.7: Figure 6 - Collapse rows to a unique patient with a diabetes indicator.
2.7 Conclusions
With this tutorial, we’ve learned how to merge two data files from MEPS and collapse them to a dataframe of unique patients. MEPS has additional data files that contain information that might be important for your work. For example, we can use these methods to merge the Prescription Drug file and create indicators for patients who are on opioids. However, you will need to carefully read through the documentation for each data file to understand what kind of information they contain. Feel free to explore using these strategies to merge additional MEPS data files to your existing cohort.
2.8 Acknowledgements
There are a lot of tutorials on how to use MEPS data with R. I found the AHRQ MEPS GitHub page to be an invaluable resource.
David Ranzolin has a great presentation on how to use the mutate function in R. I liked the examples he used, and the presentation is succint and informative.
Another great resource is by Joachim Schork, author and founder of Statistics Globe who wrote a great blog about collapsing data on a unique identifier.
I learned how to use the left_join function from this blog by Sharon Machlis on InfoWorld. She uses dplyr to invoke the left_join function which is a based on SQL language.
This is a work in progress, and I may update this in the future.